
提到BI產品,直觀想到的就是圖表,還有把圖表拼在一起的Dashboard。這確實是BI的功能之一,但核心還是要回到分析這件事。
那麼BI平台要怎麼更好的幫助分析?
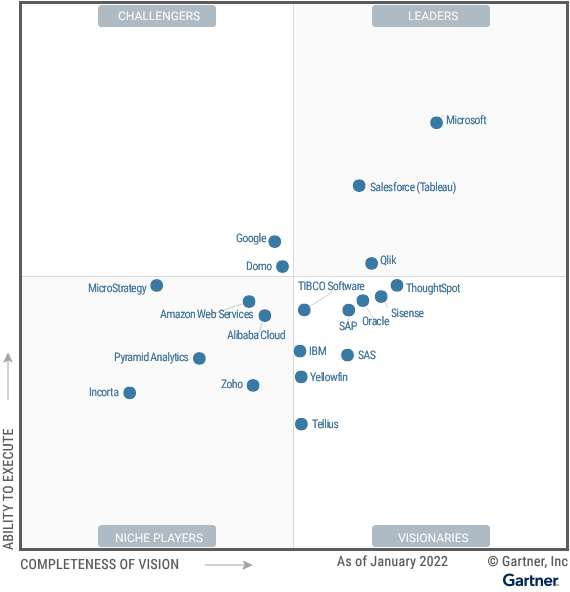
2022年3月22日,一年一度的Gartner BI魔力象限出來了!報告的資訊量挺大的,最近這段時間根據<Magic Quadrant for Analytics and Business Intelligence Platforms> 報告中涉及到的BI產品及技術趨勢進行了一些總結,也研究了多個BI產品,讓我們一起來看看吧!
如果你對Gartner這篇報告有興趣,文末獲取領取方式!
一、12個關鍵功能
報告中Gartner總結了12個關鍵功能,可以理解為是BI產品的未來趨勢。我自己理解是三個大方向:治理、雲、AI(或是叫Data Augmentation)
由於翻譯多少會失真,我把原文都貼上來,12個關鍵功能跟描述分別是:
- Security: Capabilities that enable platform security, administering of users, auditing of platform access, and authentication.
- Governance(formerly called “manageability”): Capabilities that track usage and manage how information is created and shared from prototype to production.
- Cloud-enabled analytics: The ability to build, deployand manage analytics and analytic applications in the cloud, based on data both in the cloud and on-premises, and across multicloud deployments.
- Data source connectivity: Capabilities that enable users to connect to and ingest data contained in various types of storage platforms, both on-premises and in the cloud.
- Data preparation: Support for drag-and-drop, user-driven combination of data from different sources, and the creation of analytic models (such as user-defined measures, sets, groups and hierarchies).
- Catalog: The ability to display content to make it easy to find and consume. The catalog is searchable and makes recommendations to users.
- Automated insights: A core attribute of augmented analytics, this is the ability to apply machine learning (ML) techniques to automatically generate insights for end users (for example, by identifying the most important attributes in a dataset).
- Data visualization: Support for highly interactive dashboards and the exploration of data through the manipulation of chart images. This includes an array of visualization options that go beyond those of pie, bar and line charts, such as heat and tree maps, geographic maps, scatter plots and other special-purpose visuals.
- Natural language query: This enables users to query data using terms that are either typed into a search box or spoken.
- Data storytelling: The ability to generate news style data stories—combining headlines, narrative text, data visualizations and audiovisual content based on the ongoing monitoring of findings.
- Natural language generation: The automatic creation of linguistically rich descriptions of insights found in data. Within the analytics context, as the user interacts with data, the narrative changes dynamically to explain key findings or the meaning of charts or dashboards.
- Reporting: This capability provides pixel-perfect, parameterized and paginated reports that can be scheduled and burst to a large user community.
二、我的解讀
Security、Governance、Cloud-enabled、Data source connectivity、Catalog放一組,重點想針對 Data preparation 、Automated insights、Data visualization、Natural language query、Data storytelling 、Natural language generation、Reporting,這也是我認為,若是成熟了,以後可能不需要有大量數據分析師了。
2.1 Security、Governance、Cloud-enabled、Data source connectivity、Catalog
安全
所有產品對於安全都有一定的要求,數據又是更敏感的訊息,這幾年比較大的事件像是Facebook數據洩漏、歐盟隱私法。
雲端環境
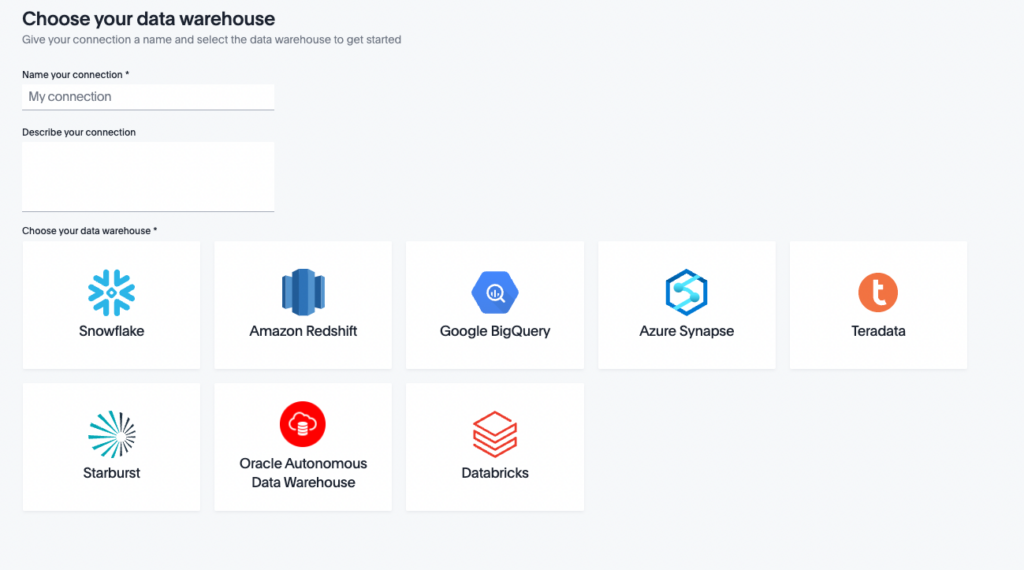
上雲這一定是個趨勢 ,一個是產品本身是否同支有Cloud服務、另外一個是對雲數據庫跟雲大數據(BigQuery Databrick Snowflake )的數據採集支持
Governance跟Catalog
都是數據資產的議題。從一線來看,數據找不到、數據不敢用是很常發生的事,如此會造成大量的協作成本;從企業而言,數據是下一個石油,既然數據這麼重要,理應要像是資產一樣管理。
The world’s most valuable resource is no longer oil, but data
The Economist ,May, 2017
再形象化一點,就像是銀行管理錢、或是你在記帳一樣。例如數據管理辦法、數據管理實施、操作規範 。
(有興趣的朋友可以看我的這篇文章:數據太髒了!3個步驟做好數據質量管理)
2.2 Data preparation 、Automated insights、Data visualization、Natural language query、Data storytelling、Natural language generation、Reporting
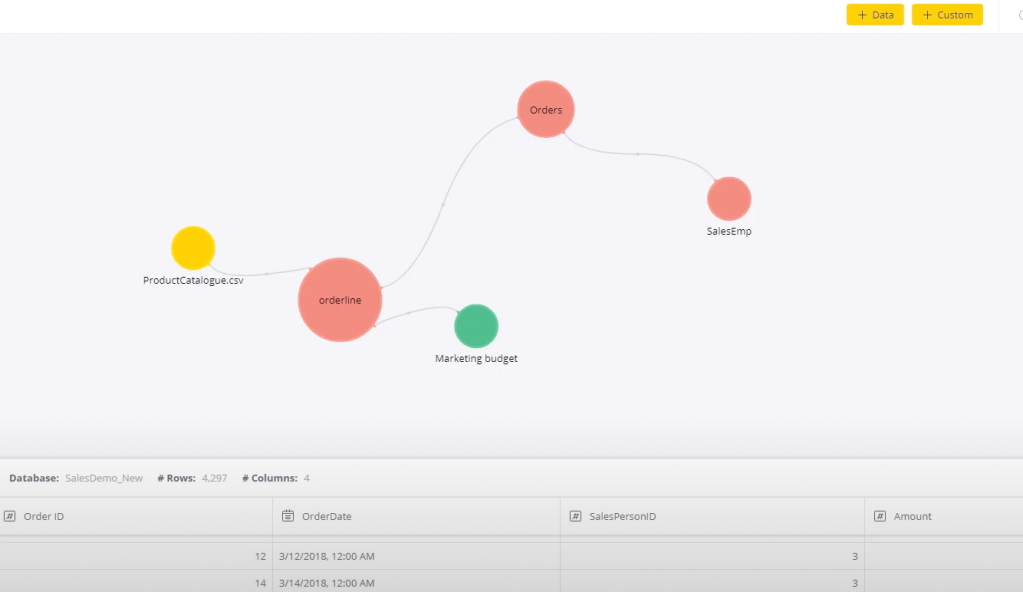
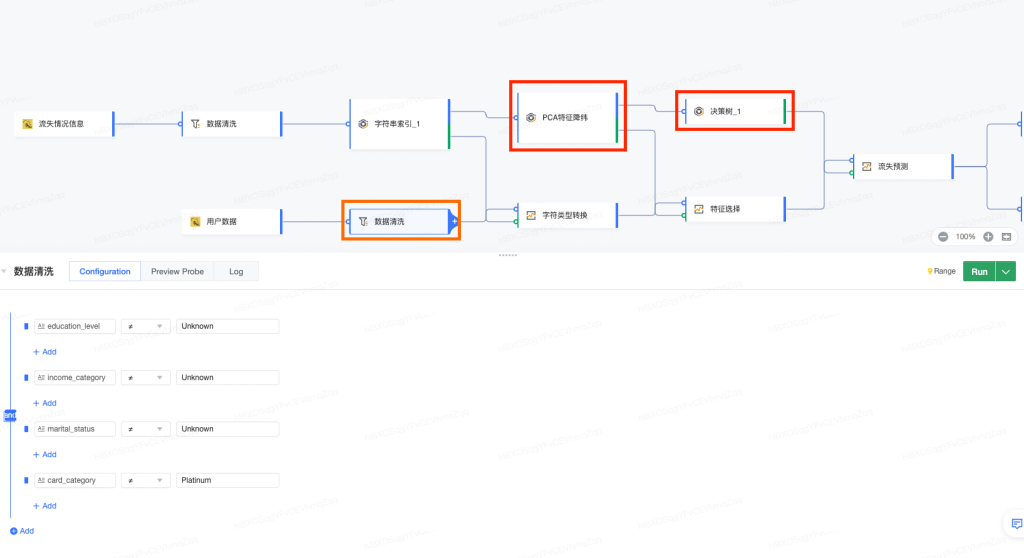
Data preparation
讓用戶透過友善的交互介面做數據處理。不只是combin table ,在數據預處理過程中的所有SQL語句都變成一個一個按鈕(也可以理解是函數)操作,用戶自己做ETL。
根據我經驗,其實這對業務方還是太難了,因為還是至少需要了解基本的SQL概念。另外Data preparation也不限SQL語句、常規的機器學習模型也是可以內置在這。
如果SQL不太熟悉,真心推薦你報名我在Hahow的 入門數據分析,掌握Hive SQL取數能力 課程 (點擊連結可以查看課程介紹)
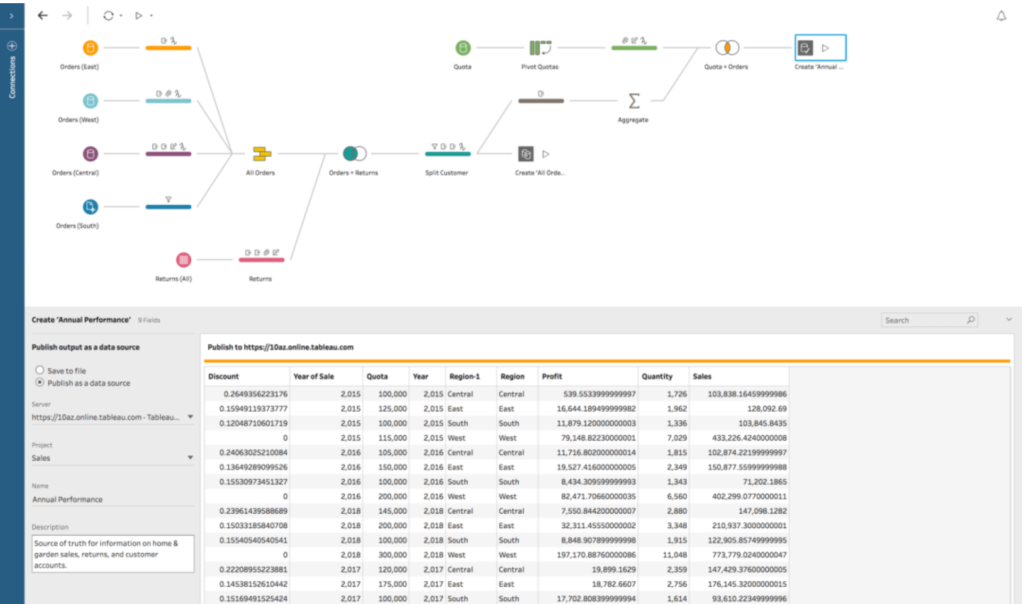
如果涵蓋這些能力,產品會滿重。估計是另一個產品經理小組設計、也可能根本就是兩條產品線(就是分開的產研團隊),例如Tableau online跟Tableau pred就是兩個產品。
Automated insights , Data visualization 跟Natural language query
對應就是分析師的取數(撈數據)、分析、監測。
哪個因素影響我的銷售額最大?未來幾個月趨勢會怎樣?我要對哪群顧客溝通?
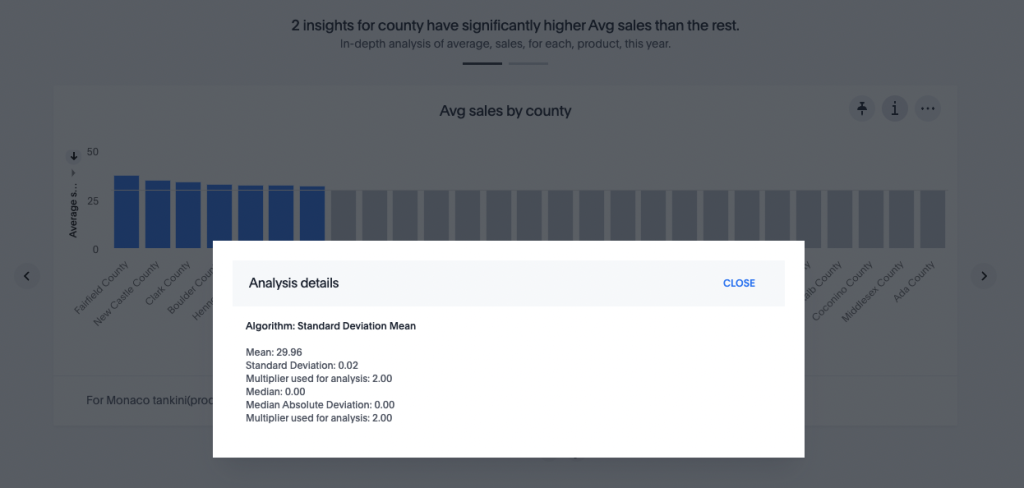
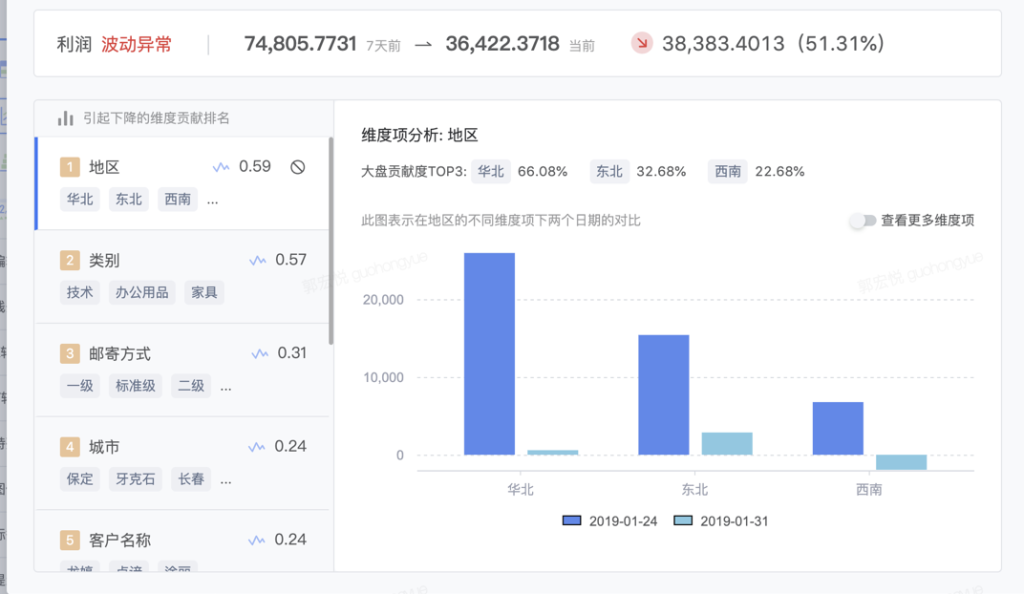
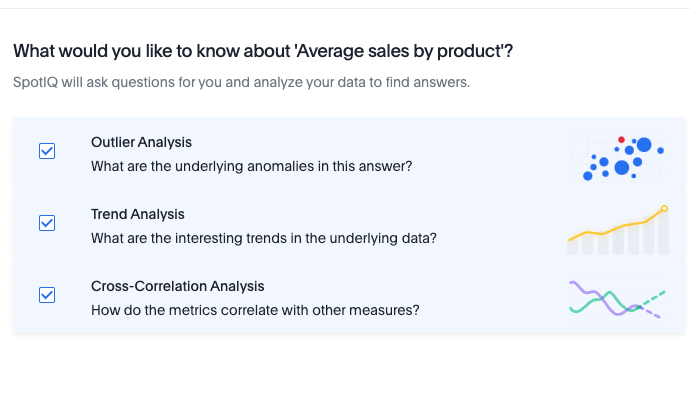
這些是常見的分析問題,但即使常見,分析過程也需要話費不少時間。透過AI,對Table大量變量(特徵)進行分析,產出insight。
例如Tableau的”Explain Data“、ThoughtSpot的”SpotIQ“、DataWind的”歸因分析“,會自動針對所選值提供由 AI 驅動的解釋。此功能會在後台檢查數百個可能的解釋,並呈現可能性最大的那些解釋
對數據有前置要求:
- Table要是一個大寬表,如果維度太少分析不到insight
- 維度也不能太多,例如超過1000個維度,不然可能會因無意義的分析維度造成誤解、且計算量過大
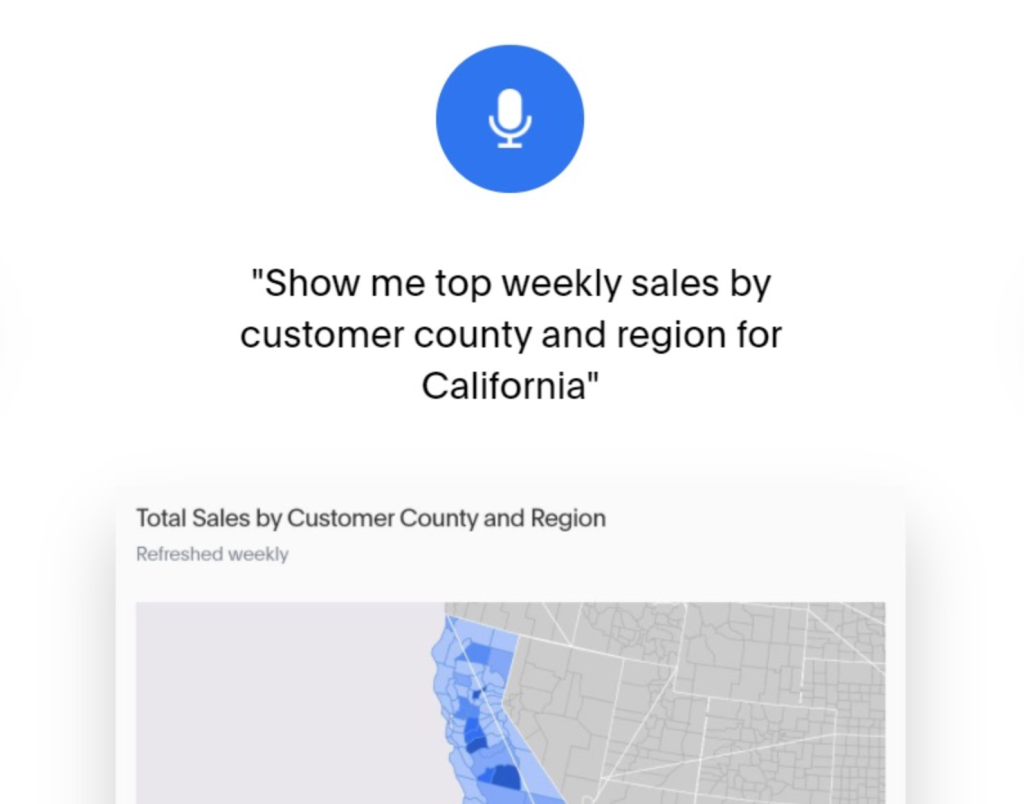
Natural language query (NLQ)
只要數據準備得夠好,以後不用取數了,說一個口語的表述系統就轉換SQL並查詢出結果,例如說『最近一年每個月的銷售額多少?』
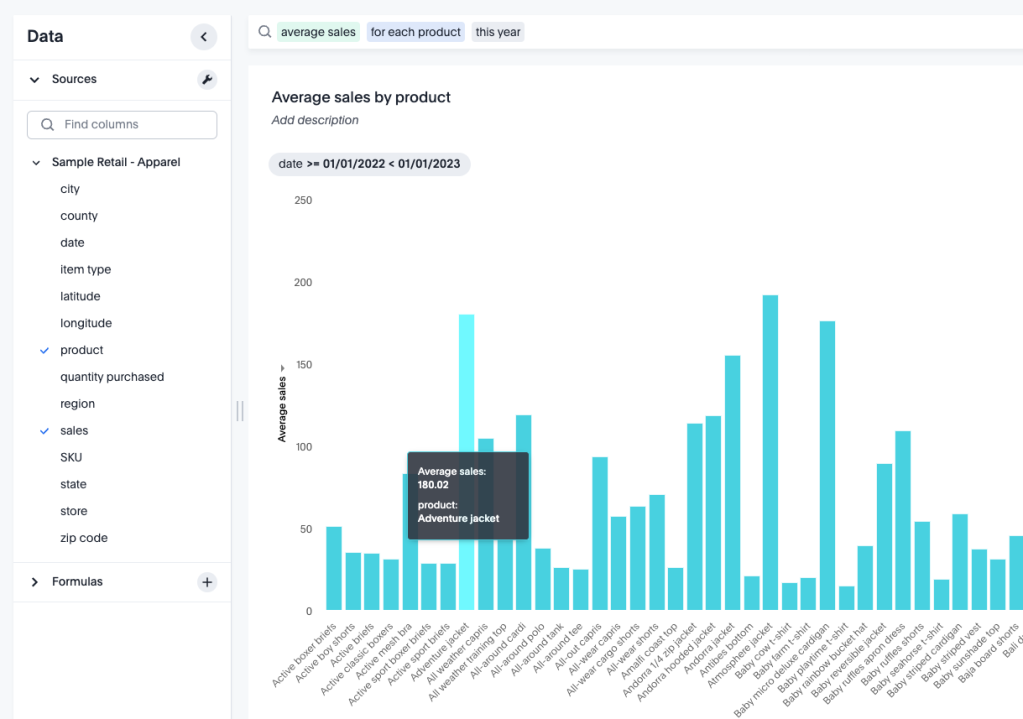
Data visualization
重點不在圖表類型的豐富度,而在“高度互動”。
像是ThoughtSpot雖然發布【Dashboard is dead】的白皮書,但dashboard仍然是監測數據的極佳方法。問題是dashboard往往只能解決”看”的問題,最近指標表現不錯、最近指標表現不好?然後呢?
所以ThoughtSpot在產品上改了個名字,叫Liveboard(有生命的dashboard?)
例如某個月銷售額有異常,我想看一下是不是哪幾個區域有特別情況,以往要重新建一個圖表、高級點的話在配置好圖表連動,在看板上形成固化的圖表。高度互動是支持終端user直接對原有圖表進行探索性的操作。
Data storytelling、 Natural language generation(NLG)、Reporting
這3個可以看成一組互相依賴的能力。
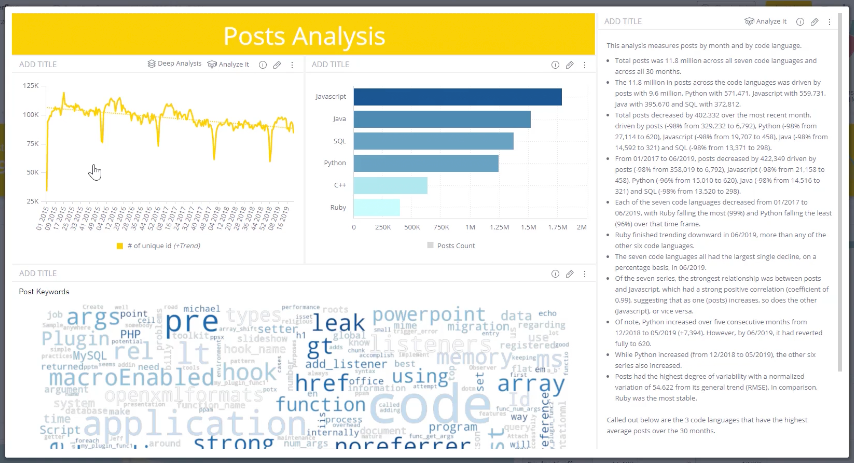
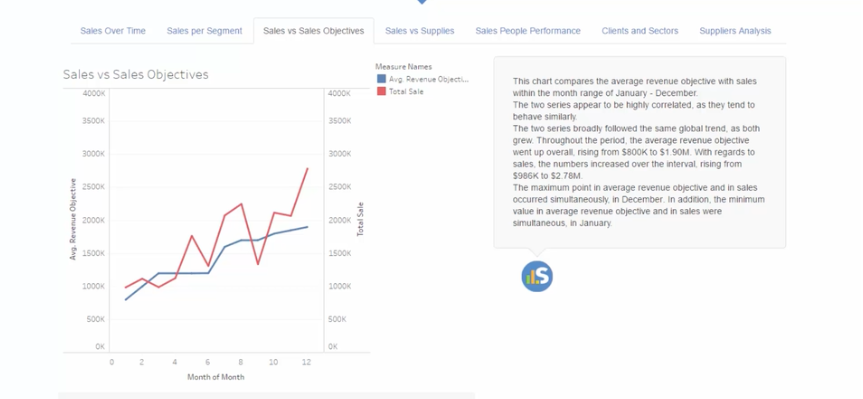
例如這個月銷售額是10W。AI對該指標從時間維度及不同維度拆解,拼成一個新的dashboard。並把看到的狀況,透過NLG,生成一個文字稿。
再例如,每天疫情數字一進來,生成文字解讀,加上輔助圖表就是一個新聞稿,然後自動發布(例如官網或其他媒體平台)
三、結尾
從我這陣子的了解,有些能力還不是真的AI,而是基於規則,有部分看起來也就是統計分析(至於實現方式給自己挖坑,我再去找找是否有什麼meet up中官方有提到)。但也可以看出AI滲透的趨勢,AI也總算準備在BI領域大放異彩。
數據分析師(Data Analyst)的朋友,重點可以了解幾個關鍵字: 增强分析(Augmented Analytics )、增強數據準備(Augmentted Data preparation) 跟Augmentted Insight Delivery
關於增強分析我也還在研究,研究到一個結果再分享(學老高挖再給自己一個坑)
要做到上述結果,前提是被分析的數據要夠好,包含數據乾淨可用、維度豐富、產出即時。這也更要求企業的數據資產建設,至少Data WareHouse的模型建設要完善些。資料工程師(Data Engineer)的朋友可以思考這塊。
希望今天的文章對你有幫助,如果你喜歡我的文章,也邀請你訂閱我的電子報 ,我們下個月見 : )
如果你對Gartner這篇報告有興趣,關注Rock Data粉絲頁 & Rock Data IG、私訊”Bi2022“(區分大小寫)免費獲取41頁報告原文!
參考:
- Magic Quadrant for Analytics and Business Intelligence Platforms-Gartner
- Tableau官網
- PowerBI官網
- ThoughtSpot官網
- Qlik官網
- Google-Looker官網
- Google Data Studio官網
- Metabase Github
- Redash Github
- Sisense官網
- 火山引擎官網
- 網易有數官網
- 觀遠數據官網
- Quick官網
自動引用通知: 搞數據還是做產品?淺談『數據產品經理』 – Rock Data|玩搖滾的數據人
It’s like you read my mind! You appear to know a lot about this, like you wrote the book on it or something. I think that you could do with some pics to drive the message home a little bit, but instead of that, this is a fantastic blog. An excellent read. I will certainly be back.